

The average TikTok engagement rate across all account sizes in 2026 sits at 4.07%, calculated by views, according to TikTok Calculator's 2026 dataset. The gap between those two tiers is nearly 5x, and it's the single most important benchmark distortion brand teams misread when setting performance targets.
The verdict for brand managers: stop comparing your account's engagement rate to a flat platform average. Benchmarking against the wrong tier is the fastest way to greenlight the wrong creative decisions.
Three numbers anchor everything that follows in this report:
- Platform average engagement rate (2026): 4.07%, view-based, across all account sizes
- Nano-tier average: 9.32% for accounts with 1,000 to 10,000 followers
- Mega-tier average: 1.87% for accounts above 1 million followers
A separate per-video sample of 2,966 viral TikToks from June 2026 found a median engagement rate of 7.49%, with top-10% videos clearing 13.59% engagement. That's a different measurement approach (per-video median versus account-level average), and the distinction matters more than most benchmark reports admit.
Key Takeaways
| Point | Details |
|---|---|
| Platform average is a starting point | The 4.07% platform average masks a range from 1.87% (mega tier) to 9.32% (nano tier). |
| Use view-based engagement rate | Calculate (likes + comments + shares + saves) ÷ views × 100 for cross-account comparisons. |
| Segment by industry before judging performance | News and politics content medians around 11.67%, fashion trails near 5.02%. |
| Reply-with-video drives comment lift | This format triggers a secondary algorithmic boost by resurfacing content to two audiences. |
| Creator collaborations close gaps fastest | Platforms like Collabonly speed up sourcing nano and micro creators through swipe matching and instant chat. |
Table of Contents
- TikTok Engagement Benchmarks 2026 at a Glance
- How Do You Calculate TikTok Engagement Rate Correctly?
- Which Industries Get the Best TikTok Engagement in 2026?
- How Does Follower Count and Content Format Affect Engagement?
- How Often Should Brands Post on TikTok in 2026?
- How Has TikTok Engagement Changed From 2024 to 2026?
- A Step-by-Step Workflow for Reading Your Own Benchmarks
- What Tactics Actually Move the Needle on TikTok Engagement?
- Why Creator Collaborations Are the Fastest Lever for Engagement Gains
- How Are These TikTok Benchmarks Actually Collected?
- What the Benchmarks Get Wrong If You Read Them Too Literally
- Speed Up Creator Discovery Instead of Chasing Benchmarks Alone
- Sources
- FAQ
TikTok Engagement Benchmarks 2026 at a Glance
Before diving into methodology and industry nuance, here's the compact snapshot marketing teams check first when prepping a quarterly report.
These figures use view-based engagement rate: (likes + comments + shares + saves) divided by views, multiplied by 100. That denominator choice is deliberate. Follower-based formulas, which divide the same numerator by follower count instead, produce dramatically different absolute numbers and can make a low-reach account with a small but loyal following look artificially strong.
A few things worth flagging before you drop these numbers into a deck:
- "Good" engagement in 2026 generally means beating the 4.07% platform average by a meaningful margin, not just matching it.
- "Top-quartile" performance, based on the FYPNow per-video sample, starts somewhere around the 7% to 8% range for a single video.
- "Top 10%" performance clears roughly 13.6% engagement per video, per the FYPNow dataset.
Pro Tip: When you pull engagement numbers for a board deck, always state which denominator you used. A 9% "engagement rate" calculated on followers and a 9% rate calculated on views are not the same claim, and mixing them across reporting periods will eventually get you challenged in a budget meeting.
How Do You Calculate TikTok Engagement Rate Correctly?
Marketers routinely conflate three different formulas, and that confusion is the single biggest source of benchmark disputes inside brand teams. Here's how each one works.
View-based engagement rate: (likes + comments + shares + saves) ÷ views × 100. This is the canonical formula recommended by most 2026 creator marketplaces and benchmark reports, according to Admetrics, because it measures how compelling your content is to the people who actually saw it, independent of how large your following is.
Follower-based engagement rate: (likes + comments + shares + saves) ÷ followers × 100. This version tells you what share of your total audience is actively interacting, which is useful for tracking community health over time but misleading for cross-account comparisons since TikTok's algorithm routinely shows content to non-followers.
Reach-based engagement rate: total engagements ÷ unique accounts reached × 100. Less commonly reported publicly, but the most precise version when you have access to your own account analytics.
The component metrics worth tracking individually, not just rolled into a single ratio:
- Likes (the largest volume signal, but the weakest indicator of real interest)
- Comments (a stronger signal of resonance, since commenting takes more effort than tapping a heart)
- Shares (the strongest distribution signal, since a share means someone is vouching for your content to their own network)
- Saves (a strong intent signal, especially for informational or how-to content)
- Average view rate and watch time (not captured in the standard engagement formula but critical to whether TikTok's algorithm keeps distributing your video)
Pro Tip: Use view-based ER as your canonical cross-brand benchmark. Reserve follower-based ER for tracking your own account's community loyalty quarter over quarter. Reporting one number as if it answers both questions is where most internal benchmarking conversations go wrong.
Which Industries Get the Best TikTok Engagement in 2026?
Industry context changes what "good" means more than any other variable in this report. A 6% engagement rate is unremarkable for a relationships-focused creator account and exceptional for an automotive brand.
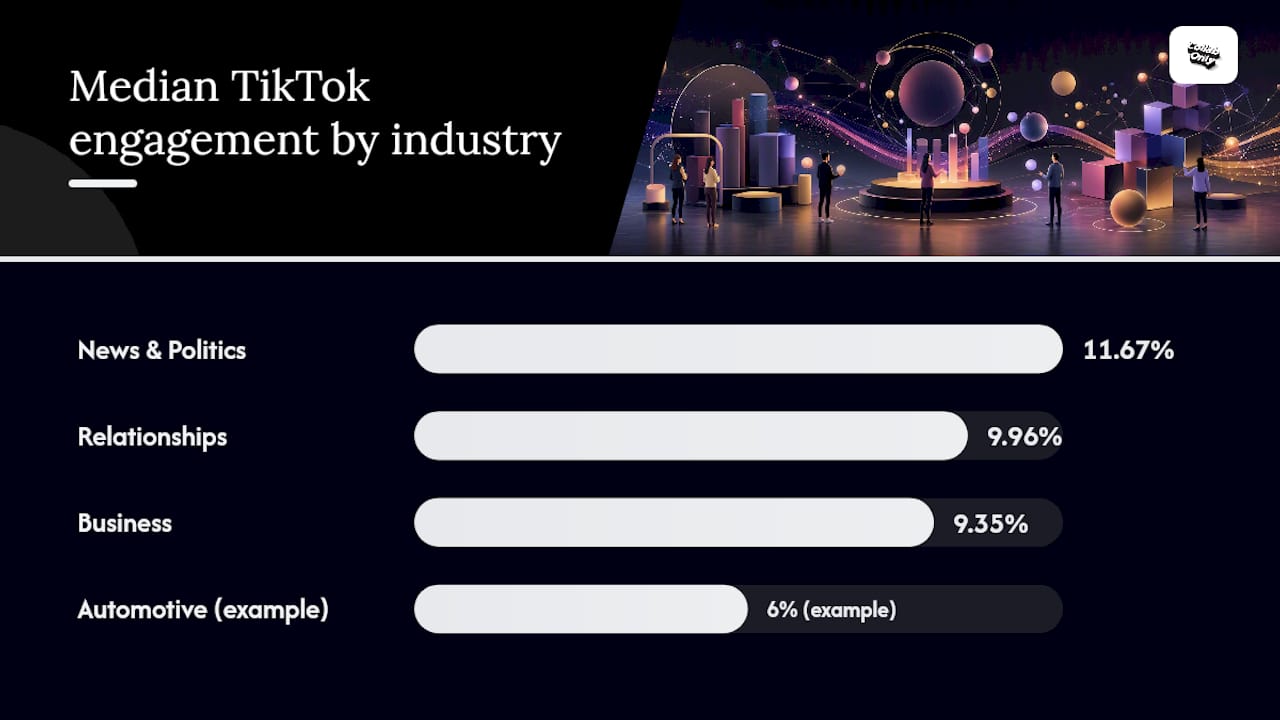
News and politics content leads at a median of 11.67% engagement, followed by relationships content at 9.96% and business content at 9.35%.
Hootsuite's 2026 industry update corroborates the general pattern: categories built around opinion, identity, and financial decision-making consistently generate higher interaction rates than categories built around product aesthetics or big-ticket purchases with long consideration cycles.
Why the split? News and politics content triggers strong emotional reactions that translate directly into comments and shares, both of which carry more weight in the engagement formula than passive likes. Relationships content invites personal disclosure in the comment section, which keeps threads alive for hours after posting. Business and finance content performs well because audiences save it for later reference, and saves are a high-value signal TikTok's algorithm rewards with continued distribution.
Fashion and automotive underperform for a structural reason, not a creative one. Both categories lean heavily on visual admiration rather than participation. A viewer can appreciate a product shot without feeling compelled to comment, and purchase consideration cycles for a car or a designer bag are too long to generate the immediate save-and-share behavior that drives comment and finance content.
A few caveats before you benchmark your own vertical against these numbers:
- Sample sizes for niche categories in most public datasets range from a few hundred to a few thousand videos, which means smaller sub-niches carry wider percentile bands and less statistical confidence.
- A single viral outlier can shift a niche median meaningfully when the underlying sample is small, so treat one-quarter comparisons cautiously if your industry sees low TikTok volume.
- If your vertical isn't listed above, look at the closest adjacent category by content function (educational, aspirational, opinion-driven, transactional) rather than by literal product category.
How Does Follower Count and Content Format Affect Engagement?
Follower tier and content format interact in ways that catch a lot of brand teams off guard, especially teams that just graduated from micro-influencer budgets to mid-tier partnerships.
This inverse relationship, smaller accounts consistently posting higher engagement, holds across every dataset examined for this report, including the tier-level breakdown from TikTok Calculator. Mid-tier accounts see the sharpest improvements tied to content professionalization, meaning the jump in production quality between amateur and semi-professional creators pays off more at that stage than at any other.

Format matters just as much as follower count. Short skits and POV-style content tend to drive likes and shares because they're built for quick emotional payoff and easy resharing. Informative or educational content drives saves and, notably, longer watch times, which feeds TikTok's distribution algorithm even when the raw engagement rate looks modest. Reaction content drives comments because it invites the viewer to agree, disagree, or one-up the reaction. Reply-with-video content, where a creator responds directly to a viewer comment in a new video, tends to outperform standalone posts on comment rate specifically, since it signals to the algorithm that a genuine two-way conversation is happening.
Pro Tip: Reply-with-video content often gets a secondary algorithmic boost because TikTok surfaces it to both the original commenter's network and the creator's existing audience simultaneously. If your brand or creator partners aren't using this format at least occasionally, you're leaving a low-cost engagement lever on the table.
How Often Should Brands Post on TikTok in 2026?
Posting cadence benchmarks split into two camps: accounts posting 3 to 5 times per week and accounts posting daily or more. Neither cadence is universally correct, and the right answer depends on production capacity and content type more than an arbitrary frequency target.
| Cadence | Typical Average View Rate | Best Suited For |
|---|---|---|
| 1 to 2x per week | Lower, inconsistent reach | Highly polished, campaign-driven brands |
| 3 to 5x per week | Moderate, steadier reach | Most brand accounts and mid-tier creators |
| Daily or more | Highest cumulative reach, lower per-video reach | High-volume creators, trend-reactive accounts |
Accounts posting daily generally see higher cumulative reach across a week but lower average view rate per individual video, since the algorithm has less signal accumulated on each single post before deciding how far to distribute it. Accounts posting 3 to 5 times weekly tend to see the best balance between per-video reach and sustainable production quality, which is why that cadence has become the practical default for most brand teams.
Timing windows matter less than most legacy social media advice suggests. TikTok's algorithm weighs content freshness against predicted relevance to the individual viewer, meaning a strong video posted at a suboptimal hour still tends to outperform a weak video posted at a "perfect" time slot. That said, testing shows engagement pools around early evening hours in a viewer's local time zone, when people are more likely to be scrolling passively rather than working.
Pro Tip: Brands running always-on accounts should optimize cadence for production sustainability first and timing second. A creator or brand team that burns out trying to hit a daily quota will see quality drop faster than an inconsistent timing window will cost you in reach.
How Has TikTok Engagement Changed From 2024 to 2026?
Engagement benchmarks haven't stayed flat over the past two years, and the direction of change matters for anyone setting multi-year growth targets.
Cross-platform benchmark data shows TikTok's average engagement climbing sharply, with one 2026 report citing engagement up 49% year-over-year to roughly 3.70% under a follower-based methodology, a very different absolute number from the 4.07% view-based figure cited earlier in this report, which underscores again how much denominator choice affects the headline number you see quoted. Regardless of methodology, the direction is consistent: TikTok engagement climbed meaningfully from 2024 into 2026, while comparable platforms saw flat or declining rates over the same window.
Tier-level shifts also point toward a maturing creator middle class. Mid-tier accounts have closed some of the gap with nano accounts as professionalized content production has become more accessible, while mega accounts have seen engagement compress further as their audiences skew toward passive consumption rather than active interaction.
Independent tier-level datasets converge on the same underlying pattern even when their absolute numbers differ: engagement rate falls as follower count rises, and the steepest drop happens between the nano and micro tiers rather than at the top end of the follower scale.
A quick timeline of what shifted heading into 2026:
- Late 2025: Increased algorithmic weight on save and share behavior relative to raw view count, rewarding informational and highly shareable content more than pure entertainment.
- Early 2026: Continued growth in Spark Ads adoption as brands shifted paid budget toward boosting organic-performing creator content rather than producing standalone ad creative.
- Ongoing into 2026: Widening engagement gap between nano/micro tiers and mega tier, reinforcing the case for creator collaboration strategies over single-influencer mega-deals.
A Step-by-Step Workflow for Reading Your Own Benchmarks
Raw benchmark numbers are only useful once you translate them into a diagnostic process specific to your account. Here's the workflow marketing teams should run before reacting to any single week of data.
- Pick the right denominator and tier. Confirm you're using view-based engagement rate for cross-account comparisons, and identify which follower tier your account currently sits in so you're benchmarking against the right median.
- Measure a 30-day rolling engagement rate. Single-video spikes and dips are noisy. A rolling average smooths out viral outliers and one-off underperformers, giving you a more honest read on trend direction.
- Compare against industry and tier medians. Cross-reference your rolling average against both your follower tier's benchmark and your industry vertical's benchmark, since the two can point in different directions.
- Prioritize gaps by business objective. A comment-rate gap matters more for a brand chasing community building; a share-rate gap matters more for a brand chasing organic reach growth.
Once you've run the numbers, a short diagnostic checklist helps identify what's actually broken:
- Is your view count healthy but engagement low? That usually points to a creative or hook problem, not a distribution problem.
- Is your view count itself low relative to your follower base? That points to a distribution or algorithmic relevance issue, often tied to inconsistent posting or weak early engagement signals.
- Is engagement strong but concentrated in likes with almost no comments or shares? That suggests passive approval without real resonance, a common trap with purely aesthetic content.
When performance gaps persist past 60 to 90 days despite creative iteration, that's typically the threshold for escalating to paid amplification or a structured creator collaboration program rather than continuing to test in-house alone.
Pro Tip: Don't escalate to paid spend before you've ruled out a creative problem. Spark Ads amplify what's already working; they rarely fix a video that isn't resonating organically in the first place.
What Tactics Actually Move the Needle on TikTok Engagement?
Not every tactic marketers try delivers a measurable lift, and the research points to a fairly clear ranking of what's worth testing first.
- Strong creative hooks in the first three seconds. Ad benchmark data consistently shows that creative quality drives CTR more than narrow targeting on TikTok specifically, since the platform's discovery-driven feed gives weak openings almost no chance to recover viewer attention.
- Community prompts that invite specific responses. Open-ended captions generate fewer comments than prompts asking for a specific answer, opinion, or tag, since specificity lowers the effort required to respond.
- Reply-with-video responses to top comments. As covered earlier, this format reliably drives comment-rate lift and a secondary distribution boost by resurfacing content to two overlapping audiences at once.
- Creator collaborations matched to audience overlap. Partnering with creators whose existing audience already engages with adjacent content categories consistently outperforms broad-reach placements with mismatched creators.
- Spark Ads over standard In-Feed ads. Spark Ads, which boost an existing organic post rather than launching new ad creative, deliver roughly 30 to 50% higher CTR and 20 to 30% lower cost per acquisition than standard In-Feed placements, because they inherit the social proof and organic relevance signals of the original post.
For measurement, track a tight set of deltas rather than every available metric:
- CTR lift for paid amplification tests, benchmarked against the 0.90% to 1.20% median cited in 2026 ad benchmark data
- Comment-rate delta specifically for community-prompt and reply-with-video tests
- Save-rate delta for informational or how-to content formats
- Engagement-rate delta week over week for creator collaboration campaigns versus brand-owned content in the same period
Two example sequences show how a team might structure a 90-day test cycle. A direct-to-consumer skincare brand might spend the first 30 days testing hook variations on brand-owned content, the next 30 days layering in two nano-tier creator collaborations matched by audience overlap, and the final 30 days boosting the best-performing organic post with Spark Ads to validate paid lift. A B2B software brand, working with a smaller organic audience, might instead skip straight to creator collaborations in month one, since business-vertical engagement medians run meaningfully higher than most B2B teams assume, and spend months two and three refining which creator tier delivers the best comment-rate return relative to cost.
Why Creator Collaborations Are the Fastest Lever for Engagement Gains
Brand-owned content alone rarely closes an engagement gap quickly, because it lacks the built-in trust a creator's existing audience already extends to them. Structured creator collaboration programs consistently close that gap faster than iterating on brand-only creative.
A working implementation checklist for a collaboration program includes:
- Audience match verified before outreach, not assumed based on follower count alone.
- Clear brief structure that specifies creative freedom boundaries without dictating a script word for word.
- Compensation model appropriate to creator tier, whether flat fee, performance-based, or a hybrid structure.
- UGC-for-ads handoff built into the agreement upfront, so usage rights for paid amplification aren't renegotiated after the fact.
- Source creators through audience-match filtering rather than follower count alone.
- Move from first contact to signed brief within days, not weeks, using instant messaging rather than email threads.
- Hand off top-performing organic posts to paid amplification once they clear your engagement-rate threshold.
Pro Tip: Sourcing speed is often the hidden bottleneck in creator programs. A swipe-based matching system with instant chat, the model Collabonly uses, cuts the outreach-to-response cycle from weeks of unanswered emails and DMs down to same-day conversations.
How Are These TikTok Benchmarks Actually Collected?
Every benchmark cited in this report comes from one of two data collection approaches, and knowing the difference changes how confidently you should apply a given number to your own account.
Per-video median samples aggregate engagement data across a large batch of individual videos, then report the median rather than the mean, since engagement distributions on TikTok are heavily skewed by viral outliers. The FYPNow dataset cited throughout this report used exactly this approach across 2,966 videos.
Account-sample aggregates instead average engagement across many accounts within a follower tier, which is the method behind the tier-level breakdowns from TikTok Calculator. This approach is better suited for brand-to-brand comparisons since it smooths out single-video noise.
Before applying any benchmark to your own reporting, apply these filters:
- Time window: Use a rolling 30 to 90 day window rather than a single best or worst month.
- Organic versus paid: Never blend organic engagement rate with Spark Ads or paid performance in the same benchmark, since paid content behaves differently.
- Region: Regional audience behavior varies enough that global averages should be treated as directional, not precise, for a single-market brand.
- Follower tier: Always segment by tier before comparing across accounts of different sizes.
- Minimum sample size: Treat any benchmark built on fewer than a few hundred videos or accounts as directional rather than definitive.
A short methodology checklist worth pasting into your own internal reporting template: denominator stated, time window stated, organic/paid status stated, follower tier stated, sample size or source stated.
What the Benchmarks Get Wrong If You Read Them Too Literally
The biggest mistake I see marketing teams make with TikTok benchmarks isn't picking the wrong number. It's treating a single average as a target instead of a range.
The most reliable benchmarks are the tier-specific and industry-specific ones, not the flat platform average that gets quoted most often in press coverage. If your team only takes one thing from this report, segment before you compare. Run the diagnostic workflow above before greenlighting a creative overhaul or a new paid budget, because a distribution problem and a creative problem look identical in a single aggregate engagement number but require entirely different fixes.
Speed Up Creator Discovery Instead of Chasing Benchmarks Alone
Benchmarks tell you where you stand. Closing the gap usually comes down to how fast you can get the right creator into a campaign, and that's where most brand teams lose weeks to slow email threads and DMs that never get answered. Collabonly replaces that outreach bottleneck with a swipe-based matching system and instant chat, so a match turns into a signed brief the same day instead of the same month.
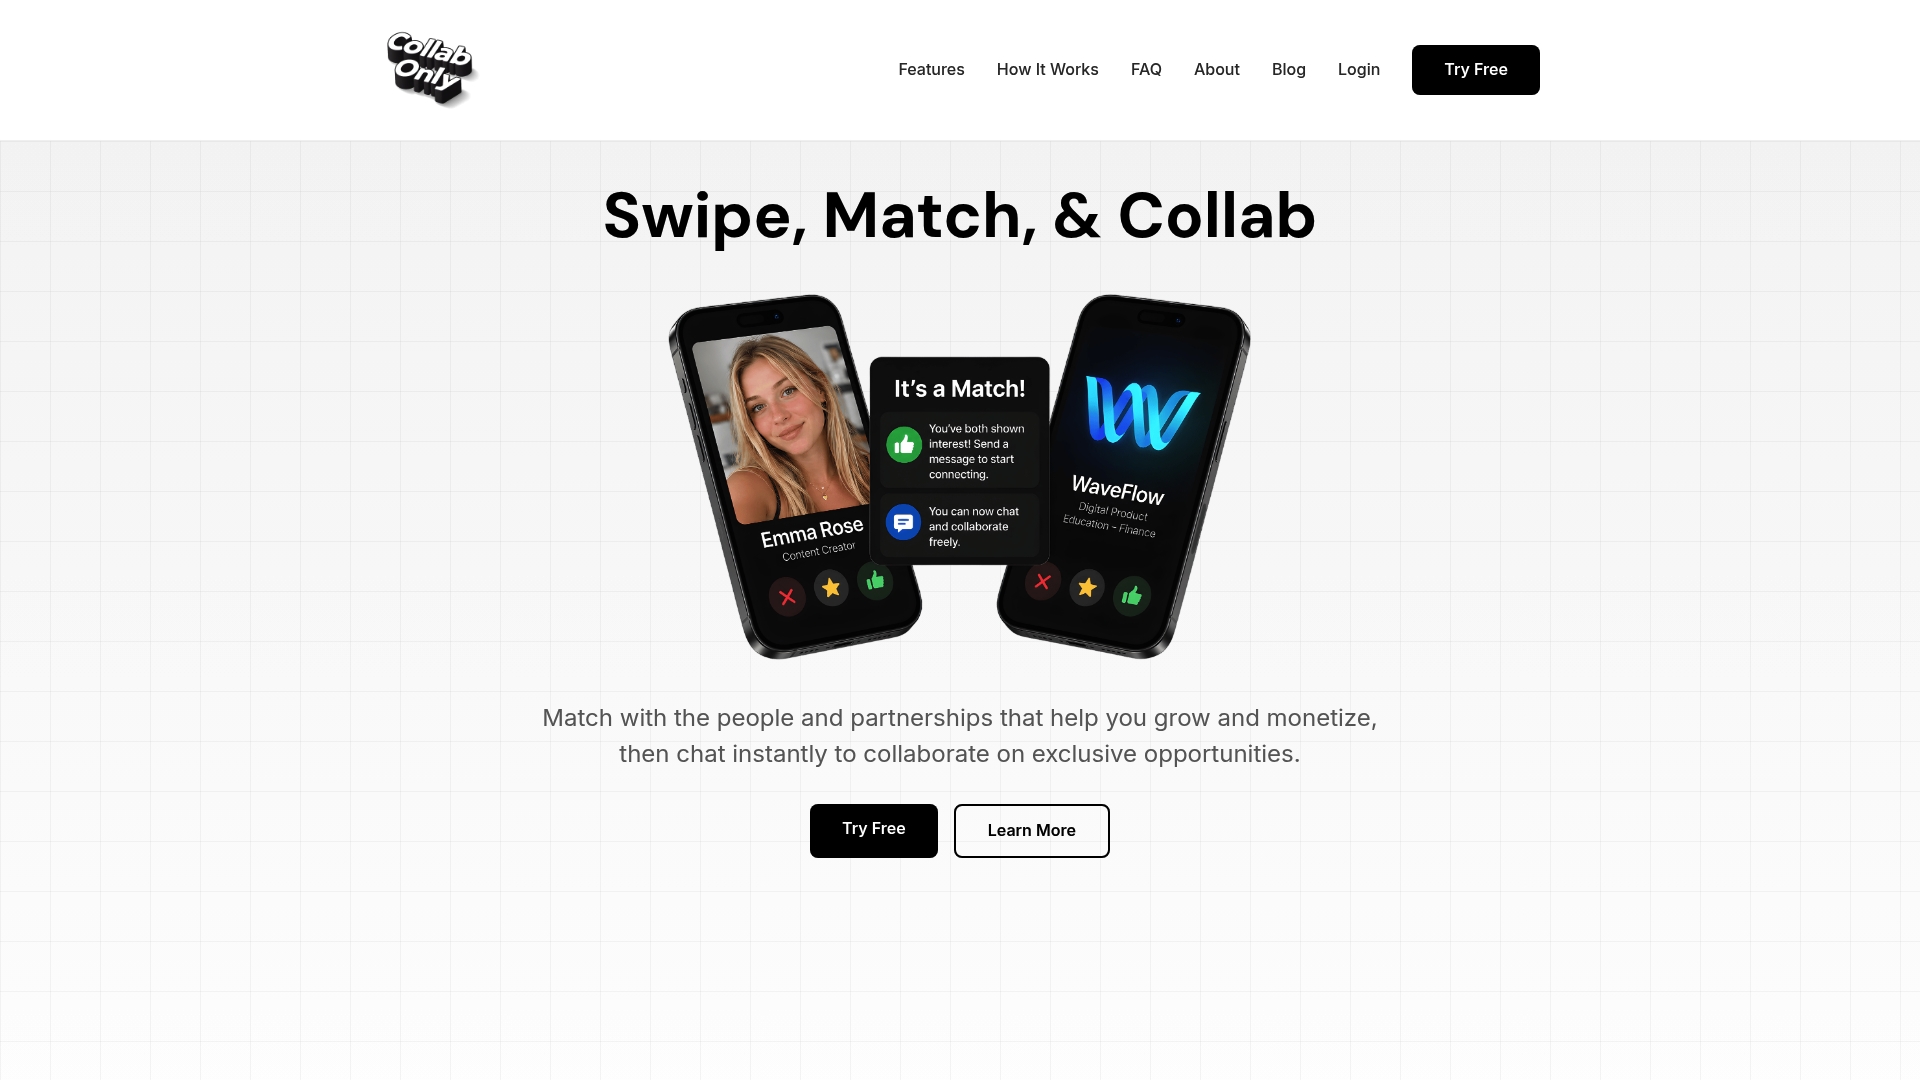
For brands trying to close the engagement gap between mega-tier reach and nano-tier trust, working with smaller creators is one of the most direct paths available. Three reasons brand teams are shifting budget toward this approach:
- Speed: Matching and messaging happen in the same platform, cutting sourcing time from weeks to days.
- Match quality: Swipe-based discovery surfaces creators by audience fit, not just follower count.
- Integrated communication: Instant chat replaces scattered email threads and lost DMs once a match happens.
If nano and micro-tier engagement rates like the ones covered in this report look like the opportunity your brand has been missing, Collabonly's nano influencer marketplace is built to get you into a conversation with a matched creator today.
Sources
- Average TikTok Engagement Rate by Follower Count 2026
- TikTok Engagement Rate Benchmarks 2026 (2,966 Videos Analyzed) | FYPNow
- What is a good TikTok engagement rate in 2026? · Admetrics
- Average engagement rates for 12 industries 2026 update
FAQ
What Are the Benchmarks for TikTok Engagement Rates in 2026?
The 2026 platform average is 4.07% engagement by views, ranging from 9.32% for nano accounts to 1.87% for mega accounts, according to TikTok Calculator's tier breakdown.
Is 5% Engagement Good on TikTok?
What Is a Good Engagement Rate on TikTok?
"Good" depends on your follower tier and industry: nano accounts should expect around 9.32%, while mega accounts averaging 1.87% are performing normally at that level, per FYPNow's per-video analysis.
How Do I Increase TikTok Views in 2026?
Creator collaborations sourced through platforms like Collabonly can also extend reach into audiences your brand account doesn't already have.

Should I Use Follower-Based or View-Based Engagement Rate?
View-based engagement rate, (likes + comments + shares + saves) divided by views, is the canonical formula for cross-account benchmarking recommended by Admetrics, while follower-based rate remains useful for tracking your own account's community loyalty over time.