

Interactive content converts passive audiences into active participants, producing measurable lifts in engagement, dwell time, and lead quality that static formats cannot match. Forbes reports a 52.6% higher engagement rate for interactive versus static content, while benchmark analyses show engagement multipliers and conversion rates significantly higher in comparative studies. According to HubSpot's aggregated data, 45% of B2B buyers rank interactive formats among their top three preferred content types.
Marketers who deploy interactive formats should expect three primary outcomes:
- Higher engagement and dwell time, which send stronger behavioral signals to search engines
- Improved conversion rates from audiences who self-qualify through structured inputs
- Zero-party data: declared preferences and intent signals captured directly from user interactions
Key Takeaways
Interactive content's role in modern marketing is to convert passive attention into measurable participation, producing engagement rates, conversion lifts, and lead quality improvements that static formats consistently fail to match.
| Point | Details |
|---|---|
| Engagement uplift is documented | Interactive content produces 52.6% higher engagement rates than static content, per Forbes practitioner coverage. |
| Conversion multiplier is significant | Benchmark analyses report roughly 2.4x conversion rates for interactive assets versus static equivalents. |
| 77% reuse value | Content Marketing Institute data shows 77% of marketers confirm interactive content drives repeat traffic and organic visibility. |
| Measure completion and downstream pipeline | Track completion rate, conversion rate, and MQL/SQL progression — not just page views — to prove ROI. |
| Collabonly scales distribution | Collabonly's creator matching platform helps brands distribute interactive assets through aligned creators on TikTok, Instagram, and YouTube. |
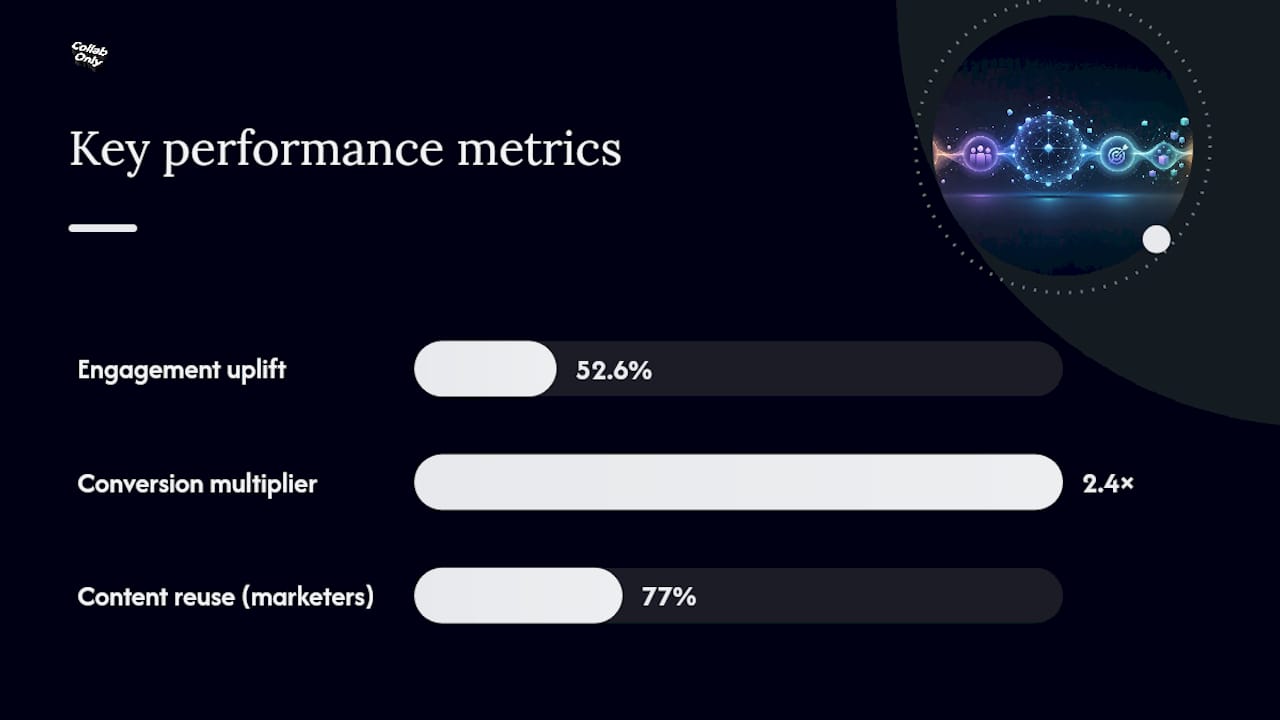
Table of Contents
- What interactive content actually is — and what it is not
- Why interactive content delivers stronger business outcomes
- Which interactive formats work at each funnel stage
- How to measure the impact of interactive content
- Design and operational best practices that prevent common failures
- Tools to build interactive content — Ceros, Typeform, Outgrow, and SnapApp
- A 5-step pilot plan to test interactive content in 6–8 weeks
- Short examples of interactive content across funnel stages
- How Collabonly helps you scale interactive campaigns with creators
- When interactive content is worth the investment — and when it is not
- Sources
- FAQ
What interactive content actually is — and what it is not
Interactive content is any digital asset that requires active user participation and returns a personalized or dynamic output based on that participation. The defining traits are two: the user must do something (answer, configure, calculate, select), and the experience must respond differently depending on what they do.
Common formats include personality quizzes, ROI calculators, product configurators, self-assessment tools, interactive infographics with filterable data, branching video narratives, polls, and augmented reality try-on experiences. A static white paper delivers the same text to every reader. An interactive assessment delivers a scored report tailored to each respondent's answers — a fundamentally different value exchange that audiences increasingly expect from brands.
Why interactive content delivers stronger business outcomes
The behavioral mechanism is straightforward: when a user actively participates rather than passively scrolls, cognitive engagement increases. That engagement translates into longer dwell time, lower bounce rates, and a higher probability of completing a conversion action.
The business outcomes that follow from this mechanism include:
- Higher time on page and reduced bounce rates, both of which function as SEO engagement signals that can improve organic visibility
- Better conversion rates — benchmark analyses document roughly 2.4x conversion lifts for interactive assets versus static equivalents
- Improved lead quality through zero-party data: structured inputs from quizzes and assessments capture declared intent, which sales teams can use to prioritize higher-probability leads
- Shareability and linkability — interactive tools that provide genuine utility function as link magnets, earning backlinks and social shares that static content rarely generates organically
- Brand recall: participation creates a memory trace that passive reading does not
Content Marketing Institute data reinforces the reuse argument: 77% of marketers agree interactive content has reusable value that contributes to repeat traffic and improved organic visibility. A well-built calculator or assessment can drive traffic for months without additional production spend.
Statistic to anchor your business case: Interactive content generates 52.6% higher engagement than static content on a like-for-like basis, making it one of the highest-leverage format decisions a content team can make.
Which interactive formats work at each funnel stage
Different formats serve different stages of the buyer journey. Choosing the wrong format for the funnel stage is one of the most common reasons interactive campaigns underperform.
| Format | Funnel Stage | Primary Use Case | Build Complexity | Key Measurable Outcome |
|---|---|---|---|---|
| Social poll / Stories quiz | TOFU | Awareness, audience segmentation | Low | Impressions, response rate |
| Personality quiz | TOFU | Lead generation, brand affinity | Low–Medium | Completion rate, email capture |
| Interactive infographic | TOFU–MOFU | Education, organic sharing | Medium | Time on page, backlinks |
| Self-assessment / scored report | MOFU | Lead qualification, nurture trigger | Medium | Completion rate, MQL conversion |
| ROI / savings calculator | MOFU–BOFU | Purchase justification, sales enablement | Medium | Conversion rate, pipeline influence |
| Product configurator | BOFU | Purchase decision, personalized demo request | High | Conversion rate, average order value |
| Interactive video (branching) | TOFU–MOFU | Storytelling, product education | Medium–High | Watch completion, click-through |
| AR/VR experience | BOFU | Try-before-you-buy, immersive demo | High | Engagement depth, conversion |
| Interactive report / data explorer | MOFU | Thought leadership, account-based marketing | Medium–High | Time on page, downloads |

Low-cost alternatives exist for most formats. Social polls on LinkedIn or Instagram Stories quizzes serve as TOFU tests before committing to a full quiz build. Embedded Google Sheets calculators can validate demand for a more polished ROI tool. Social media content formats that already perform well for your audience are natural candidates for interactive upgrades.
How to measure the impact of interactive content
Measurement starts before the asset goes live. Define the primary KPI for each asset at the brief stage, map it to a business outcome, and configure tracking before launch.
Core KPIs to track:
- Completion rate: the percentage of users who finish the interaction (industry benchmarks vary by format; quizzes typically see 40–60% completion when kept under 7 questions)
- Interaction depth: number of clicks, selections, or inputs per session — a proxy for engagement quality
- Time on page / dwell time: compare against your site average for the same content category
- Conversion rate: form completions, email captures, or CTA clicks as a percentage of asset visitors
- Downstream MQL/SQL progression: track whether leads from interactive assets convert to pipeline at a higher rate than leads from static formats
- Social shares and backlinks: measure organic amplification over a 30–90 day window
Measurement checklist for implementation:
- Tag every interactive asset URL with UTM parameters (source, medium, campaign, content)
- Configure event tracking in Google Analytics 4 or your analytics platform for each interaction milestone (quiz started, question answered, result viewed, CTA clicked)
- Map form completions to your CRM (HubSpot, Salesforce, or equivalent) so lead source is preserved through the pipeline
- Set up an A/B test comparing the interactive asset against the incumbent static asset on the same traffic source
- Schedule a 30-day and 90-day review to assess completion rates, conversion rates, and downstream pipeline influence
For interactive content SEO specifically, monitor crawlability and ensure your interactive asset's core content is indexable — JavaScript-heavy implementations can block search engine access to the content if not configured correctly.
Design and operational best practices that prevent common failures
The most frequent reason interactive content underperforms is complexity, not concept. Academic research published in Communication Research cautions that overly complex interactive experiences reduce effectiveness; intuitive design is a prerequisite, not a nice-to-have.
Operational rules that apply across formats:
- Keep interactions short: quizzes under 7 questions, calculators with no more than 5 inputs, assessments that take under 3 minutes to complete
- Design for mobile first: the majority of interactive content is consumed on smartphones; test every interaction on a 375px viewport before launch
- Map every asset to a specific journey stage and a specific next action — an interactive asset without a clear CTA wastes the engagement it generates
- Use progressive profiling: ask for one or two data points in the interaction itself, then request additional information in the follow-up email sequence rather than front-loading a long form
- Address privacy and consent: disclose how user inputs are stored and used, particularly when capturing zero-party data for CRM enrichment
Pro Tip: Gate the personalized result, not the interaction itself. Let users complete the quiz or calculator without friction, then require an email address to receive their full report or score. This approach typically produces higher completion rates and better-quality leads than gating the entry point.
Tools to build interactive content — Ceros, Typeform, Outgrow, and SnapApp
The tool landscape has expanded considerably, and low-code options now allow marketing teams to build and launch interactive assets without developer support. The four platforms most frequently cited in practitioner guides each occupy a distinct position.
-
Ceros is best for rich, visually immersive interactive experiences — branded microsites, interactive lookbooks, and editorial content that requires pixel-level design control. Build time is higher than form-first tools, and pricing reflects an enterprise orientation. Ceros assets embed cleanly into existing web properties and integrate with major analytics platforms.
-
Typeform leads on form-first quiz and assessment experiences. Its conversational interface reduces perceived friction, which tends to improve completion rates for lead-generation quizzes. Typeform integrates natively with HubSpot, Salesforce, Mailchimp, and Zapier, making CRM mapping straightforward. Pricing scales with response volume.
-
Outgrow is purpose-built for marketing calculators, graded assessments, and recommendation engines — formats that map directly to MOFU and BOFU conversion goals. Its template library covers ROI calculators, product recommenders, and scored assessments. Outgrow's analytics dashboard reports completion rates and conversion data without requiring a separate analytics configuration.
-
SnapApp (now part of Uberflip) focuses on quick lead-generation quizzes and content experiences designed for B2B demand generation. It is particularly well-suited to content marketers who need to build interactive assets at volume and distribute them across multiple channels without a dedicated design resource.
Pro Tip: Before committing to an enterprise platform, validate your concept with a free or low-cost tool. Typeform's free tier supports basic quizzes; Google Forms can approximate a scored assessment. Run the concept for 30 days, measure completion and conversion, then invest in a more capable platform if the data justifies it.
For teams using AI to lower production costs, several of these platforms now include AI-assisted content generation for quiz questions, calculator logic, and result copy — reducing time-to-launch for new interactive assets.
A 5-step pilot plan to test interactive content in 6–8 weeks
A structured pilot limits risk, produces comparable data, and gives stakeholders a clear decision point at the end of the test period.
-
Choose a specific goal and audience segment. Define one primary KPI (email capture rate, MQL conversion, time on page) and one audience segment (e.g., mid-market B2B buyers in a specific vertical). Vague goals produce uninterpretable results.
-
Select the format and tool. Match the format to the funnel stage using the table in the formats section. For a first pilot, choose a low-to-medium complexity format (quiz or calculator) and a tool your team can operate without developer support.
-
Build a minimal viable interactive asset. Limit scope to what is necessary to test the hypothesis. A quiz with 5–7 questions and three result variants is sufficient to measure completion and conversion behavior. Avoid custom development at this stage.
-
Publish and promote with controlled traffic. Drive a defined volume of traffic to the asset — paid social, email to an existing list, or organic placement on a high-traffic page. Controlled traffic sources make attribution cleaner. Use content promotion tactics that align with your audience's preferred channels.
-
Measure and iterate. At 30 days, review completion rate, conversion rate, and time on page against your benchmarks. At 60–90 days, assess downstream MQL/SQL progression for leads captured through the asset. If completion rate exceeds 40% and conversion rate exceeds your static content baseline, scale the asset and test a second format.
Minimum success criteria for a first pilot:
- Completion rate: 40% or higher
- Conversion rate: at or above the static content baseline for the same traffic source
- Time on page: measurably above the site average for the content category
Connect every asset to your CRM and email marketing platform from day one. Zero-party data captured through interactive inputs loses most of its value if it sits in a standalone tool and never reaches the systems your sales and nurture teams use.
Short examples of interactive content across funnel stages
The following use cases illustrate how different formats perform across the funnel, with the primary KPI and expected result for each.
| Format | Funnel Stage | Industry / Use Case | Primary KPI | Expected Result |
|---|---|---|---|---|
| Personality quiz ("Which marketing channel fits your brand?") | TOFU | B2B SaaS / brand awareness | Email capture rate | High completion; strong list growth |
| Interactive infographic (filterable industry benchmark data) | TOFU | Professional services / thought leadership | Time on page, backlinks | Extended dwell; organic link acquisition |
| Scored assessment with downloadable report | MOFU | B2B technology / lead qualification | MQL conversion rate | Higher-intent leads vs. gated PDF |
| ROI calculator (cost savings by switching platforms) | MOFU–BOFU | Enterprise software / sales enablement | Conversion to demo request | Accelerated pipeline progression |
| Product configurator with personalized demo request | BOFU | E-commerce / manufacturing | Conversion rate, AOV | Higher close rate on configured leads |
A few observations on what these examples share: each asset delivers a personalized output (a result, a report, a configured recommendation) that the user cannot get from a static page. That personalization is what drives the completion behavior and the downstream conversion lift. Partnership campaigns that pair interactive assets with co-branded distribution have shown particularly strong TOFU performance, as the creator's audience arrives with pre-existing trust in the content source.
How Collabonly helps you scale interactive campaigns with creators
Interactive assets generate their strongest returns when they reach audiences who are already primed to engage. Building the asset is only half the equation — distribution determines whether the investment pays off.
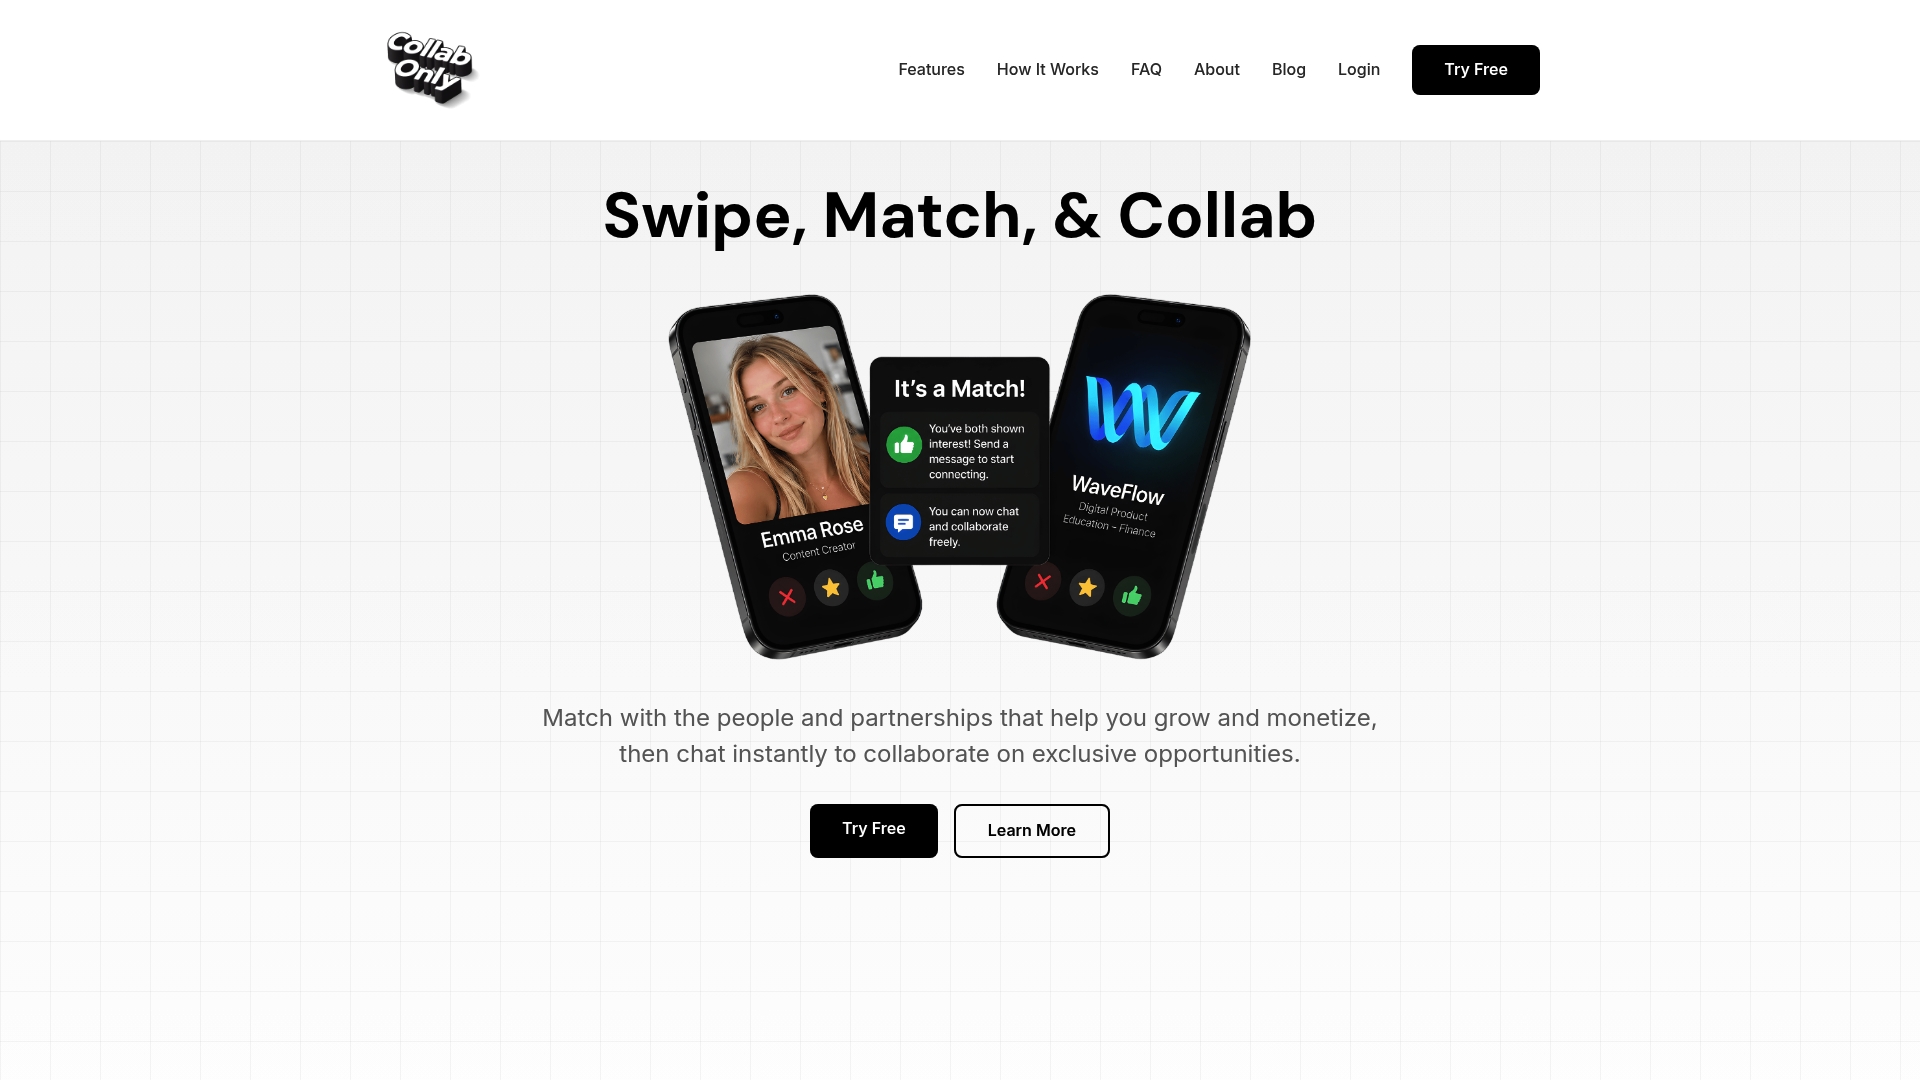
Collabonly connects brands with creators across TikTok, Instagram, and YouTube through a swipe-based matching interface that eliminates the slow back-and-forth of traditional outreach. For interactive content campaigns specifically, that means a brand can identify creators whose audiences align with the quiz topic or calculator use case, match instantly, and brief them through the platform's chat system — all without a separate influencer agency or weeks of email negotiation. Creators who participate in an interactive campaign (sharing a quiz, co-authoring an assessment, or driving traffic to a calculator) extend the asset's reach to audiences that paid media alone cannot access efficiently. Micro-influencer partnerships are particularly effective for this distribution model, as their audiences tend to show higher engagement rates and stronger completion behavior on interactive formats.
The next step is straightforward: create a free Collabonly account, define your campaign goal, and match with creators whose audience profile fits your interactive asset's target segment.
When interactive content is worth the investment — and when it is not
The case for interactive content is strong, but it is not universal. The formats that produce the clearest ROI are those where the personalized output delivers genuine utility to the user — a score that reveals something actionable, a calculation that quantifies a real decision, a recommendation that saves research time. When an interactive asset is built primarily as a novelty or a traffic tactic without a clear value exchange, completion rates drop and the data captured is low-quality.
The practical recommendation is to start with one asset, one goal, and one measurable KPI. Repurpose a high-performing static asset — a benchmark report, a product comparison page, a frequently asked question — into an interactive version before investing in custom development. The 5-step pilot plan in this article is designed for exactly that scenario: a 6–8 week test with a defined success threshold that gives the team a clear decision point before committing additional budget.
Interactive content also works best when distribution is planned before the asset is built. A quiz with no promotion plan will underperform a simpler asset with a well-matched creator audience behind it. That is the operational gap Collabonly addresses — matching the asset to the right distribution partner before the campaign launches.
Sources
- Content Marketing Institute
- 21 Interactive Content Stats That Marketers Need to Know
- Engage Your Audience With Interactive Content - Forbes
FAQ
What is the role of interactive content in marketing?
Interactive content converts passive audiences into active participants, producing measurable lifts in engagement, dwell time, conversion rates, and lead quality. Its primary role is to replace one-way content consumption with a value exchange that captures zero-party data and accelerates pipeline progression.
What are the main benefits of interactive communication?
Interactive communication increases cognitive engagement, reduces digital fatigue, and produces personalized outputs that users find more relevant than static content. The measurable benefits include higher completion rates, stronger conversion performance, and declared-intent data that improves lead qualification.
What is the role of interactive media in education and training?
Interactive media in education shifts learners from passive reading to active problem-solving, which research consistently associates with better retention and knowledge application. Assessments, simulations, and branching scenarios are the most effective formats for learning-oriented interactive content.
Which interactive content formats work best for lead generation?
Quizzes and scored assessments are the most reliable lead-generation formats because they deliver a personalized result that justifies the email capture. ROI calculators perform strongly at MOFU and BOFU stages, where the output directly supports a purchase decision.
How do you measure whether interactive content is working?
Track completion rate, conversion rate, and downstream MQL/SQL progression as the three primary indicators. Compare each metric against the static content baseline for the same traffic source, and assess pipeline influence at 60–90 days to determine whether interactive leads convert at a higher rate.